Does repetition lead to mastery of a skill, and (if it works) how do we apply it to our trading? “Repetition is the mother of skill” comes from Tony Robbin’s “Awaken the Giant Within”. While I do not fully agree with Tony’s ideals, I do believe that this specific lesson is true. Trading is a skill that can be enhanced with hours and hours of repetition. To test the effects of repetition, I am going to put myself through the task of analyzing 100 charts for significant market structure.

The task is to go over 100 chart examples and mark out significant swings on each chart by:
- Marking out EVERY first order swing highs and lows
- Marking out EVERY second order swing highs and lows
- Marking out EVERY third order swing highs and lows, if any
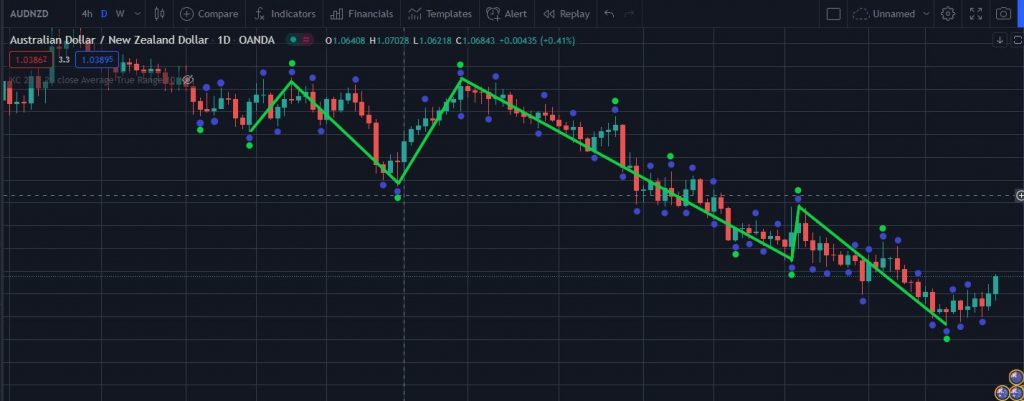
- Connecting either the second or third order swing highs and lows to create swing structures.
I am going to use the following rules:
- If the swing highs or lows do not alternate, go for the greater magnitude of the repeated highs or lows.
- Not strict price checks – only visual checks will be used.
- Use one dot to show first order swing highs/lows, two dots to show second order swing highs/lows and three dots to show third order swing highs/lows. The image below shows the above rules for second order swings on the AUDNZD 1D chart:

The goal of this test is to see if the repetition of this task every day will lead to some form of mastery in identifying important market structure. This type of analysis is in hindsight to the real-time price action, however it is useful to understand this structure to influence future trading decisions. I hope to use this exercise to:
- See if I am able to identify these swings easily without needing to analyze the first order swing highs/lows.
- To determine if the relationship between repetition and mastery exists. In this experiment, the mastery will be measured by being able to identify these major market structure without the deep analysis.
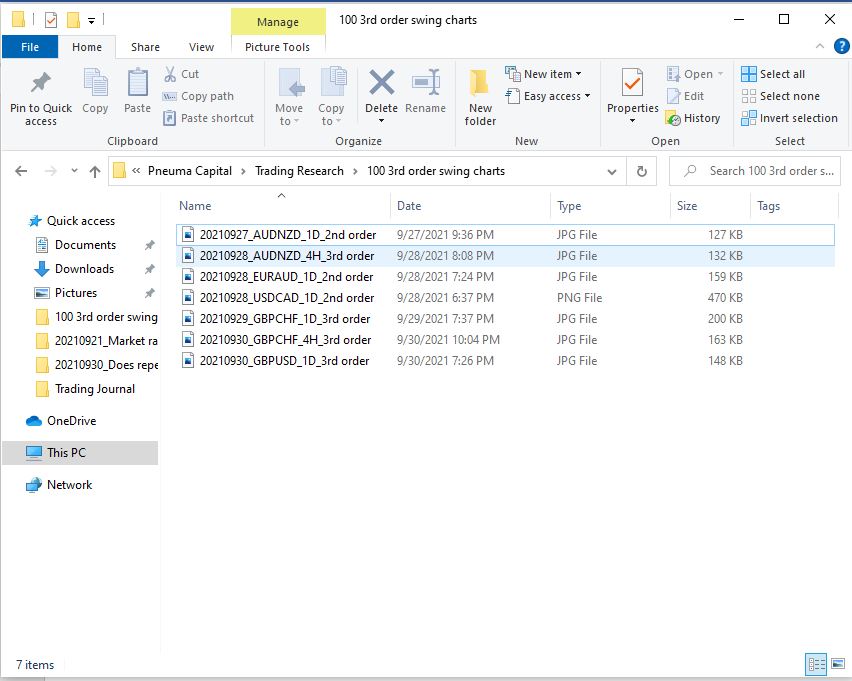
Once the below list is completed, we will check back in a separate blog detailing the findings of this experiment. If you want these screenshotted charts, please let me know and I will gladly share my progress:


